

Taking a picture of the seafloor is a complicated business. In some industries it is a multi-billion dollar business. Acoustic technology, however, has allowed us to do amazing things and very quickly the mysteries of the sea are becoming fewer and fewer. It does not come without a price nor investment in training. I recently attended a workshop and training conference in Seattle, Washington to hone my skills in collecting and processing sonar data.

This is the 2008 graduating class at the CTI training seminar in Seattle, Wa.
(WARNING: The following text has been laced with technologically-heavy verbiage. Use caution when reading. Side effects may include: boredom, Wandering Thought Syndrome, and blurry vision. To reduce perceived side effects remove victim to final paragraphs where more flippant text and lighter topic has been applied.)
Since the acquisition of our Klein 3900 Search and Recovery Sidescan Sonar we have been gathering sonar data from the First Coast area as well as a couple other areas around Florida. Sonar surveys in the San Sebastian River, Matanzas Bay, Salt Run, the near-offshore waters of St. Augustine, the Tolomato River, and elsewhere have provided a large amount of data with which to work. Gathering the data, while no simple task by itself, is no less complex than performing a task we call “post-processing”. Post processing is a term used largely within data-rich work communities but if you catch a fish and then gut and scale it, you’ve ‘post-processed’ it. In order to use sonar data in a meaningful way mosaicing must be performed. I’ve discussed this in more detail in earlier blogs but will re-visit it here since the application is poignant to this story.

This image shows two subbottom profiler swaths where they intersect at a perpendicular angle. The image is a screenshot taken from a 3D viewer where the real files can be rotated and viewed in a 3D world.
Each pass we make with the sonar produces a swath of data. Acoustic waves are translated into a visual image readily (well, fairly readily) understood by the human eye. These linear images or swaths then need to be mated to their neighboring swaths or overlaid to produce a continuous picture of the seafloor. Since we survey transect lines that mimic patterns used to cut grass we need to have a composite image known as the mosaic. The sonar broadcasts its signal multiple times a second, depending on how fast or slow we want to send and receive data as well as the frequency at which it is send. Our GPS navigation system sends a location fix to the sonar once each second. This way, each one-second packet of sonar data can be labeled with its earthly position and thus connected to the next packet in the swath. The tough job is to mate these swaths together, apply the proper bends and curves that represent boat turn-arounds as well as deviations made by the helmsman due to wind, current, or poor driving. This is where Chesapeake Technologies Inc. comes in.
Started by John and Eileen Gann in the 1990s Chesapeake Technologies designs and writes software specifically for the marine survey industry. Companies that use sidescan sonar, subbottom profilers (used to peer into the sea-floor), and magnetometers rely on both a hardware provider as well as software providers to make their jobs possible, efficient, and easier. Chesapeake’s flagship software is called SonarWiz.MAP and LAMP bought a license for it in December of 2007. The software you receive with the sonar itself allows the user a stable but fairly rudimentary interface with the raw data. SonarWiz.MAP provides a staggering array of options to post-process data as well as integrate multiple types of datasets. Chuck, Sam and I attended the first Chesapeake training seminar last year. Hosted in Charleston, this was our very first introduction to the program and, while very informative, was like trying to, as Sam put it “trying to drink from a firehose”. Since then I have been working with the software, when possible, to build up my skillset at manipulating (note: not massaging) our sonar data to represent an accurate depiction of our survey areas. I’ve come a long way and have successfully mosaiced about a dozen different surveys and submitted four reports to clients and partners. However, this software is first generation stuff and with that comes the growing pains of a rapidly-developing technology. Just about every two days a new version of SonarWiz.MAP comes out. The version I am running at the time of writing will have been superseded by at least one updated version by the time you read this. The reason for this is because software grows much like a baby after conception. From the single-cell egg of an idea to a running, jumping, talking program a great many things take place and with a rapidity that is astounding. Purchasing and using the software is a great commitment since not only is the initial cost outlay significant but the maintenance and proper feeding of it is vital. Just as a child has flaws it learns to correct the software, through manufacturer/client dependence, learns not to pick its nose in public (or not to overlap sonar files where sonar files shouldn’t overlap). As a SonarWiz.MAP user I have discovered many of these deficiencies myself and communicated with the software engineers to help them develop a better product.
Without getting too rich in detail and running the readership off with technospeak, lets discuss briefly what takes place in SonarWiz.MAP that makes it such a ‘Wiz.BANG’ product. A raw sonar file come off of the boat much like a salmon off the deck of the F/V Golden Alaska, a beautiful thing but needing some ‘value added’ things to make it a marketable item.The first thing I do is to make something called the ‘gain’ is properly set. This is, in effect, adjusting the volume of the files so that the visual image is not too bright or dark overall and that all of the collected data is imported without getting left behind or faded out due to excessive power. Once I’ve tested a single file to discover this threshold, I’ll then begin to import all of the files from the project. Sometimes I have taken note during survey that remind me later I only need certain files to hone in on a known target and then I’ll pick just these. At this point I am looking at the first produced mosaic of the data but we are far from being done here. Each file must be individually ‘bottom tracked’. This process follows a principle that the sonar uses to ‘find’ the sea floor and properly track its undulations and consistency changes. Often this tracking ability can be disturbed by debris (such as schools of fish) in the water column, very soft bottom types which tend to absorb some of the acoustic signal, or water quality changes such as a thermocline. I manually insert and remove points to make sure the sonar isn’t compressing or stretching data which I will later need to see in its proper projection.

Seminar in progress… (Image courtesy of CTI)
Once done with the bottom tracking I then go through each file again, this time checking for proper signal return strength so certain areas of the sonar swath don’t get shaded out or are projected too brightly. This involves multiple parameters which I’m sure if you did the calculations, would offer millions of possibilities of individual settings. But, as I have worked with these more, have understood more about what they effect in image quality. This process may end up taking a fair amount of time to complete since I can be working with several dozen files, sometimes even several hundred. When the files begin to lose their humps and bumps in color and brightness change and now are more uniform I will go back through them again and cut some files in half, trim the ends of some files to get rid of bad data generated in survey turn-arounds, and may even delete superfluous files.
By now the survey has begun to look like a good seafloor image and the detail is beginning to show itself. One of the most vital aspects of post-processing has yet to be completed however. This is the part where I go back through each file to do what is called “digitizing features”. For me this is one of the most interesting times because it is where I get to really look for any details on the bottom which may indicate possible cultural material of historic interest. Anything resting on the seafloor, or even a change in the seafloor type, can be called an anomaly. Anomaly isn’t a value-heavy word though and if an anomaly which is particularly intriguing or holds promise for us is identified it is now called a ‘target’. Targets are the stuff by which maritime surveyors live and breathe. The whole reason for a sonar survey is often to generate target lists. The archaeologist or surveyor can then send down a diver, ROV (remotely operated vehicle), or submersible vehicle to investigate the target. At this point, and it may take several investigations to make a determination on a target’s viability, the real discoveries are made. Sometimes, and archaeologists are really lucky when this happens, target determinations can be made in the field such as when the sonar passes over a readily identifiable wreck.

Here’s screencapture of what SonarWiz.MAP looks like when its processing a mosiac. This particular image is from the San Sebastian River. Note the ability to place a nautical chart behind the mosiac.
Each anomaly or target can get an identifying number and symbol on the mosaic. This number identifies the anomaly in a database created by the user, annotated to represent known and unknown targets; things like rock outcroppings, jetties, seafloor cables and pipelines often populate these databases. An entry in the database will include the latitude/longitude (although the user can select from over 100 coordinate systems), comments on the nature of the item, the mensuration (measurements) of the anomaly or target, and even a confidence indicator providing information as to the post-processor’s surety in judgment about target identification. This last feature I don’t use but the Navy does when they use SonarWiz.MAP to locate possible mines on the seafloor or other questionable materiel.

On an early morning walk down to the Ross docks, I spotted this seaplane basin. Alaska bush piplots use Lake Union as a landing strip frequently and kayakers and canoeists must use caution when traversing the lake to not get ‘landed on’.
Now that the mosaic is visually pleasing, is as clear as possible, and includes all pertinent annotation it is nice to put some context behind the mosaic. Sometimes I will actually do this step first, especially if the survey is located inland or near permanent structure. To do this a nautical chart or aerial photograph can be inserted as a basemap residing underneath the sonar mosaic. Early on, the map can be used to georeference (def: properly ascertain correct geospatial location and manipulate data to correct for geodesy variance) any wayward sonar files. Error in sonar file placement can occur multiple ways and each one of them can be readily observed if you can note the placement of a known object gathered with sonar data over a properly mapped structure. Lets say I take the sonar through the Bridge of Lions and then right by the Castillo wall, capturing segments of both the bridge and Castillo sea wall within the sonar swath. If I then project these swaths over an aerial photo or nautical chart, they had better line up. If not the user has to sleuth through the collection data to try and find out where the error exists. Most often it is caused by the sonar cable being adjusted shorter or longer and not entering the parameter change into the collection software. Fortunately, this can be corrected albeit not easily and without some wringing of hands.
Having all the sonar files in place and with all of the necessary data being accurate and well presented the work is not far from being done. If the client or recipient of the data requests it a target report can be created in a report generating feature found within the software. This feature, I have understood from folks having run sonar for years, is very handy and saves huge amounts of time. It selects a pre-made image of each target, all pertinent data associated with the target and organizes it into an electronic document that can be inserted into a Microsoft Word document. There is also a feature which allows the operator to create an .html file which is a stand-alone report you can publish on the internet or simply view using a web browser like Explorer or Firefox.
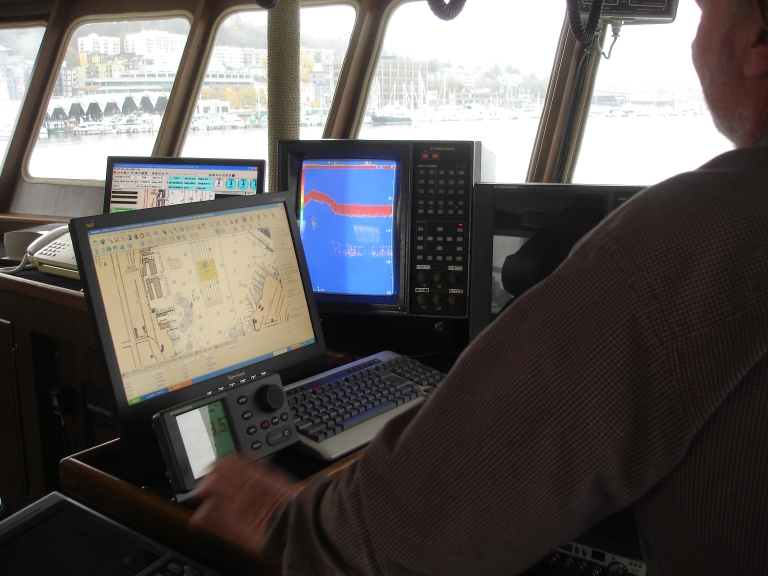
The bridge of the R/V Golden Dolphin. Note the cluster of technology.
To put this all into context it was only thirty years ago that sidescan sonar was an analogue, rather than digital, readout printed onto segments of paper. This paper would then be cut into each swath, requiring the post-processor to make some very finite judgments since you only had one chance with each record, and then organized like a jigsaw puzzle into the mosaic. The paper used to print out the mosaics on had a thermally activated glue imprinted into it so after trimming and placing, each piece could be ironed onto a larger board (usually a wall or plywood sheets) and the photographed. The photograph was then finally inserted into the final report. You can imagine the time and care it took to make one of these and that was with a resolution nowhere near what we have available at our fingertips today. Garry Kozak, of L-3 Klein, provided this unique history of sonar work to us at the end of the seminar. Garry has a million unique stories about sonar work and travels all over the world to demonstrate and troubleshoot Klein equipment.

The R/V Golden Dolphin, courtesy of Ross Laboratories. Ross is a leader in developing hydrographic electronics.
The goal of the conference was to have SonarWiz.MAP users get together in the same room to compare notes as well as go through a tutorial provided by the software engineers. We learned much more about the software and were able to share our successes and problem solving experiences. There was also a real-time mosaicing expedition onboard the R/V Golden Dolphin, which I’ll discuss in the second half of this blog. We worked through problems as well as going over the basics to make sure we are post-processing sonar data in the right order. This can make a big difference whether or not you spend ten hours on a mosaic or twenty. Chesapeake’s engineers put us through tutorials on how to edit and post-process Subbottom data, an ability that we do not currently have with SonarWiz.MAP but I was nonetheless very impressed with the potential to analyze subterranean marine features. One of the most amazing things was SonarWiz.MAP’s ability to ‘curtain’ Subbottom sonar data into a 3D file so it can be viewed using a Fledermaus freeware program which allows 3D rotation and manipulation. As an aside I would like to, at some point, be able to collect close transect Subbottom data on some of our known wrecks to then play with it in post-processing to visualize it in 3D)

Garry Kozak launching Klein’s 3900 sonar.
Conference attendees were provided with one-on-one training and Q&A sessions to work with data from home. I had taken several datasets as well as projects in states of completion and progress to have reviewed and work on there which was very handy in the evenings to fiddle with since the training was so fresh. A final option of SonarWiz.MAP offers is its export capabilities. Mosaics can be turned into georeferenced files readily accepted by many mapping programs such as AutoCAD, ESRI, and most interestingly, Google Earth. I have spent a fair amount of time working with the Google Earth capabilities and have managed to develop a nice tour of a few shipwreck sites throughout northeast Florida and a couple other areas. These images are not posted directly to Google Earth for public consumption since their sensitive locations prevent it however, I am working on a tour which has been minimally sterilized so it can be included in public presentations. In Seattle, a city with such huge technological resources and development capabilities the world of mapping has great potential to revolutionize many things. Google Earth is presently, and very quietly, spending hundreds of millions of dollars mapping the sea floor. Within a few years it is expected that a complete and accurate image of the Earth’s sea floor will be available. Many things will have to be protected since this will ‘expose’ data previously protected by the mystery of the briny deep. No doubt SonarWiz.MAP will have a role in this.
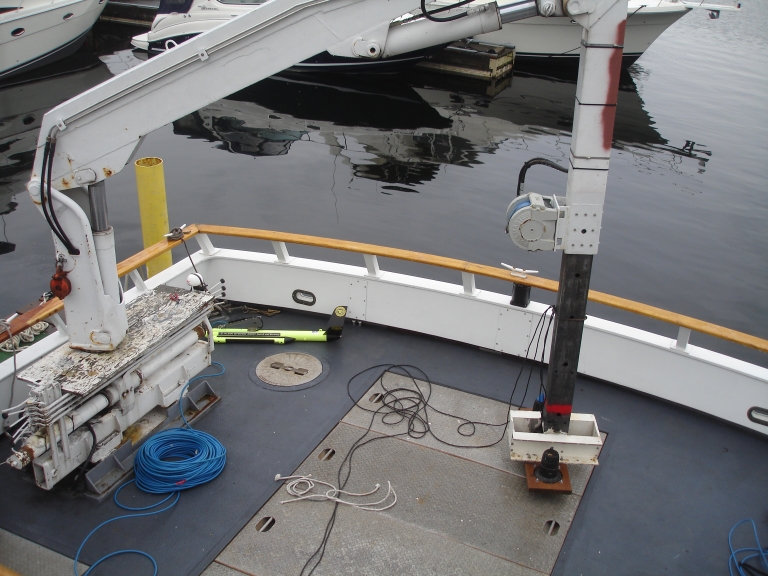
The work deck of the Golden Dolphin. Note the large hatches, these cover live wells used to house marine creatures after capture when the boat operated as a collection boat for aquariums.
Our conference experience ended on Thursday with attendees having received a heavy dose of information and ready to return to their respective offices and apply the newfound knowledge. It was interesting to meet these folks, who hailed from almost every corner of the globe. There were representatives from the Canadian Navy, the Japanese Coast Guard, a Brazilian company, Trinidad, the Mediterranean, and all over the U.S. Their jobs descriptions included port security, minerals exploration, hurricane debris mapping, rescue and salvage operations, fisheries studies, and a host of other uses, some probably classified.
(NOTE: This ends the technical portion of this bulletin. The following text has been edited for enjoyability and to protect the innocent.)

The unique waterfront of Lake Union.
I was lucky enough on this trip to spend some time with a new friend I met during a recent LAMP operation. Joe Dobarro, of the Rutgers Marine Sciences Program out of Tuckerton, N.J. was attending the conference. He had brought down the REMUS AUV, discussed in an earlier blog (make link to blog in text) and was in Seattle to work on his SonarWiz.MAP skills like the rest of us. I met up with him at the Marriott we stayed in on the shores of Lake Union. This freshwater lake is connected to the Puget Sound by a canal and a series of locks. Big vessels call Lake Union home and, as I’ll describe in more detail later, a flotilla of floating homes creates a very unique atmosphere. Behind the hotel and up on a hill was the Seattle Space Needle, an icon of the city’s outline. We were only about a fifteen-minute hike from the downtown waterfront along Elliot Bay, an offshoot of the Puget Sound. A couple of nights, after the training sessions were over the our brains were sufficiently fused-out, we walked down to the docks and saw such things like massive freighters tied up along the docks, the NOAA northern Pacific research station which docks the world’s newest and most state-of-the-art research vessel, the R/V Okeanos Explorer. On the piers were located a bevy of seafood restaurants serving up Dungeness crab, salmon of every type, clams, oysters, halibut, and other delicacies of the Pacific. Also available was a wide array of beers brewed throughout the bountiful Pacific Northwest and possessing marvelous flavors and potencies!

A grain ship riding at anchor in Puget Sound. The majestic Olympic mountains are in the background. Some parts of these mountains receive fifteen feet of rain every year!
Joe and I took full opportunity of our time off when we weren’t working on honing our skills with the day’s teachings and walked all over the place in the evenings to take in the wonders of this intriguing city. We saw the numerous piers along Seattle’s main waterfront where you would have found sailing and steamships lines up during the late 19th century carrying hopeful gold prospectors into the Pacific Northwest to being their trek to find Yukon gold. Now they support a thriving museum, restaurant, and tourist trade since modern freighters are too big to squeeze into the docks. However, Seattle is a bustling port and almost completely the opposite of St. Augustine’s sleepy trade with transient snowbirds. Huge bulk carriers rode at anchor in Puget Sound waiting to fill their holds with wheat from the Palouse. Oceangoing tugs were winding their way out into the sound to guide inbound traffic. Ferries plowed the waves between the numerous islands and peninsulas. The waterfront, at most times, was almost as busy as the land and was quite an interesting sight.

A replica of a British Navy longboat. This particular one is supposed to be modelled after the longboat carried aboard the HMS Bounty, and which Cpt. Bligh found himself skipper of after the 1789 mutiny.
After I arrived in town and before the training seminar began Joe and I got a chance to visit the Center for Wooden Boats, a mecca for wooden boat enthusiasts located on the shores of Lake Union and only about 500 meters from the hotel where the seminar was held. At the entrance was a huge log being turned into a Pacific Northwest dugout canoe. Hewed and burned from a 37 foot log, it will ultimately represent a Haida style oceangoing boat. Beyond this several dozen wooden sailing, rowing, and motoring craft greet the eye, all snugly docked around the center’s floating core, a boatbuilding shed and library. Despite being officially closed at the time there were some volunteers who opened up for us and were kind enough to answer questions and let us tour around the place. Anyone who visits Seattle in the future should make a special trip to see the magnificent place!

Joe Dobarro inspecting a Haida canoe under construction.
While we were standing on the dock admiring one of the CWB’s 18th century replica longboats, a roar overhead alerted me to a floatplane making its landing on the lake. There are several docks for these planes, mostly bush pilots from Alaska delivering people and supplies to remote portions of the 49th state. On Monday evening Joe and I met with his friends Lowell and Alyce Fritz. Alyce works with NOAA mapping and recording watersheds for use in national databases, specifically working with the marine sciences of the watersheds. Lowell has been with NOAA in Seattle for eighteen years and leads research on Stellar sea lions at the National Marine Mammal Laboratory in Seattle. He had some great stories to tell about his research up in the Aleutian Islands riding around on the wind-tousled Bering Sea trying to gather data from sea lion colonies. It was a fantastic experience to hear such in-depth stories about Alaska’s marine biology albeit not all the stories ended positively given the vigorous fisheries and effects of climate change.

The pride of the fleet, NOAA’s brand new Okeanos Explorer.
Thursday the seminar ended a little early and we had some daylight left to take a harbor cruise and take in the sights of the waterfront. Boarding the M/V Lady Mary Joe and I took our position on the fantail and departed Pier 56. The one hour cruise took us counter-clockwise around Elliot Bay. First was by the NOAA pier where we could really get a good look at the R/V Okeanos Explorer and an older research vessel the Miller Freeman. Next up was the grain docks where a large bulk carrier was tied up and we could see the dust cloud from the gaping maw of the ship’s hold. The fisherman’s terminal was next and it was an impressive sight to see the large trawlers, trollers, and factory ships tied up. Seeing this, one had to realize that we were seeing (excluding the boats actively fishing) the most modern and efficient fishing fleet in the history of man. As I wrote before in my blog on our former intern, Lindsay Jones, being stationed aboard the M/V Ocean Phoenix, these boats can catch a staggering tonnage of the sea’s biomass. To the west of the terminal were two more grain haulers. Their bulk loomed high above the Lady Mary as we got in for a closer look and a hungry world outside awaited their future cargoes. A buoy not too far away was host to a dozen California sea lions. These critters were all male since only the bulls migrate up from the southern coasts to winter. Our brief nature tour here ended with the closing visage of Seattle’s drydocks. Mammoth in size and many in number we got to see one of the high speed ferries lifted for work as well as one of the Bering Sea trawlers up for a paint job. Adjacent to the drydocks was the tug terminal. There were some giant tractor tugs that can convince thousand-foot cargo ships to stay in the channel and fight the tide at the same time. These huge tugs can motor in any direction doe to their unique propulsion system.
The Lady Mary, while quite a sizeable vessel, was again diminished by the scale of this all. Seattle’s port is one of the busiest in the world and we got to almost get underneath the giant cranes hoisting containers aboard a Korean flagged vessel. As if this wasn’t enough next on the tour was the Coast Guard docks where two icebreakers were tied up. One of them, the Polar Star, cranks out a combined 93,000hp on three shafts and can shatter some serious ice. She is one of the two most powerful non-nuclear ice breakers in the world and can continuously part six feet of ice, not including her ramming power! The last big show on the cruise was the largest vessel of them all, a Hanjin cargo liner loaded with seemingly hundreds of containers. Joe and I were lucky enough to get to see this ship depart Seattle’s dock and stand out to sea with the backdrop of a sunset over the Olympic mountains.

The Coast Guard basin, note the ice breakers on the right-hand side. The M/V Polar Star is the inboard vessel and the M/V Healy, another mega-breaker, is outboard.

The Polar Star looking for ice to bust. (Image courtesy of www.explore.co.uk/…/Polar+Star.htm)
Back on dock, Joe and I headed for a vessel we had spotted on the cruise. The F/V Golden Alaska was in town for layup and paint. Former LAMP intern Lindsay Jones had a good friend who served as a biological observer on this boat. I patently didn’t observe the ‘No Visitors’ sign as an opportunity to review a boat like this at close quarters doesn’t present itself everyday in St. Augustine. If next to a shrimp boat, even some of Florida’s largest shrimpers, the Golden Alaska would tower over it. Unfortunately no one was on board I could ask to get permission to come aboard and see the trawl deck, fishing gear, and belowdecks spaces.

The Golden Alaska, one of the wolves of the Bering Sea. She catches pollock and other groundfish. Given her volume of catch it is quite likely that you’ve had a piece of fish that has come off of this boat.
Friday morning I spent traveling back to St. Augustine and as we flew out we went right by Mount Ranier, which peaks at over 14,000ft. What a beautiful sight to end a trip to Seattle. The plane ride back was a bit less interesting as most of the country was under a blanket of clouds but I got a chance to spend a few hours working with the sonar tricks we had been taught and write this blog. Overall, the trip was a success and I look forward to applying the sonar skills to work here in the First Coast.
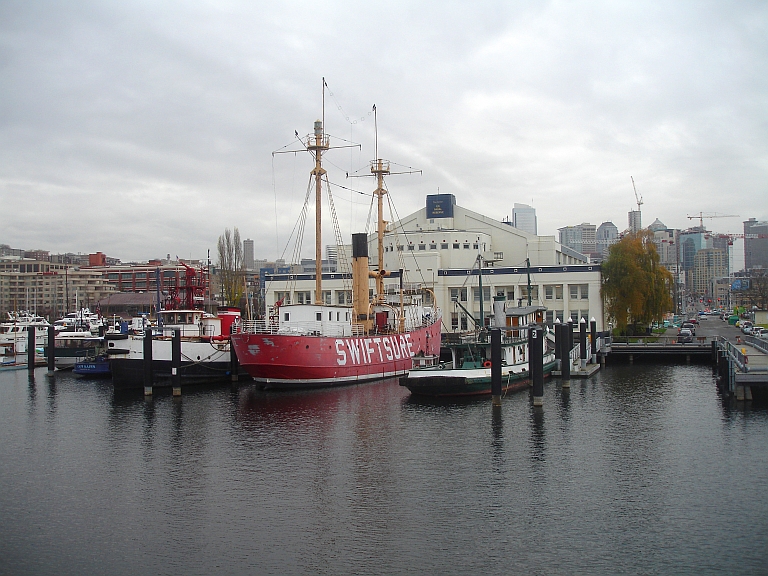
At the foot of Lake Union, and right beside our hotel is this Naval Reserve Center building and historic boat exhibit. Now decommissioned, the building and complex was a bustling waterfront for the Navy during World War II. In fact, we ran the sonar right over a navy tug that sank in Lake Union while serving the docks there.

Your author, getting in touch with the American west.
I’d like to thank Joe for his hospitality and generosity in lettine me stay on his hotel room couch. Much appreciated!