
As we begin to move into our 2016 field season, we are excited to introduce the results of the 450th Anniversary Shipwreck Survey, that the Lighthouse Archaeological Maritime Program (LAMP) carried out over the 2015 field season. The “450th Anniversary Shipwreck Survey” was a project carried out as part of LAMP’s multi-year First Coast Maritime Archaeology Project, which has been ongoing since 2007. The 450th Anniversary Shipwreck Survey, named in honor of St. Augustine’s 450th anniversary which occurred in 2015, was funded by a State of Florida, Division of Historical Resources Small Matching Grant (No. S1604).
Previous Post: Welcome to the 450th Anniversary Shipwreck Survey
Archaeologists use a lot of interesting tools to get the job done.
From spectroscopy, a method of getting an elemental fingerprint from archaeological remains, to phytolith analysis, a way of determining exactly what plants made up a long-lost environment, the archaeologist’s toolkit has become much more technological through the past several decades. In this modern technocracy, the simple trowel and screen form only part of the science.
Likewise, searching for shipwrecks at sea has increasingly relied on technology to go beyond visual survey. So much of the oceans, rivers, bays, lakes, even streams flow with waters too cloudy to see through, or are too deep to access with simple SCUBA technology. Besides, our job is to search for a shipwreck because of its historical value not just because it is in clear, warm water. And so to find these, we break out the gear.

Here we see two thirds of LAMP’s remote sensing suite: the side scan sonar (left) and the marine magnetometer (right)
LAMP uses a fairly typical suite of remote sensing gear. ‘Remote sensing’ means any tool that can recover and record data from an artifact, a feature, or a site. This data may help archaeologists find site locations or simply learn more about a site like where to dig next.
Our remote sensing gear consists of a sidescan sonar, a subbottom profiler, and a marine magnetometer. The magnetometer is the focus here, the real star of the show.
Magnetometery is not something typically associated with shipwreck hunting. However, it is one of the most useful tools. The basic theory rests on the fact that most historic shipwrecks have a magnetic field around them that disturbs the earth’s natural magnetic field.
Think of a wooden board with a knot in it. The knot disrupts the grain of the wood, causing it to deviate and bend around the knot. A shipwreck is basically a magnetic knot in the sea floor that can only be seen with the magnetometer.
To use magnetometry successfully, we must remember that the earth has a magnetic field and everything within it made from, or containing iron, has its own smaller field too. The ocean unfortunately contains a lot of debris, much of which has iron in it. This makes for many, many magnetic targets that the magnetometer finds.
To prevent archaeologists from chasing down too many paths, finding worthless trash and wasting time, there are ways of telling the good targets from the plain anomalies. Basically, we use some simple, and some not-so-simple ways to discriminate trash from shipwreck.
Prior to the 2015 field season began LAMP archaeologist Olivia McDaniel and I worked together to re-analyze older survey data. From our study we marked several targets for re-survey. During the field season we took Roper, project research vessel, and the magnetometer back out to the targets to gather high-resolution data. This meant running survey lanes very close together and all in the same direction.
While the data is very interesting, gathering the data can be tedious.
Running lanes can be tough work, especially for inexperienced helmsmen, or a helmsman rusty from a winter of drying out ashore. But once the routine settles in, it’s a simple matter of watching the instruments and ‘mowing the lawn’, the process of going round and round to complete each lane.
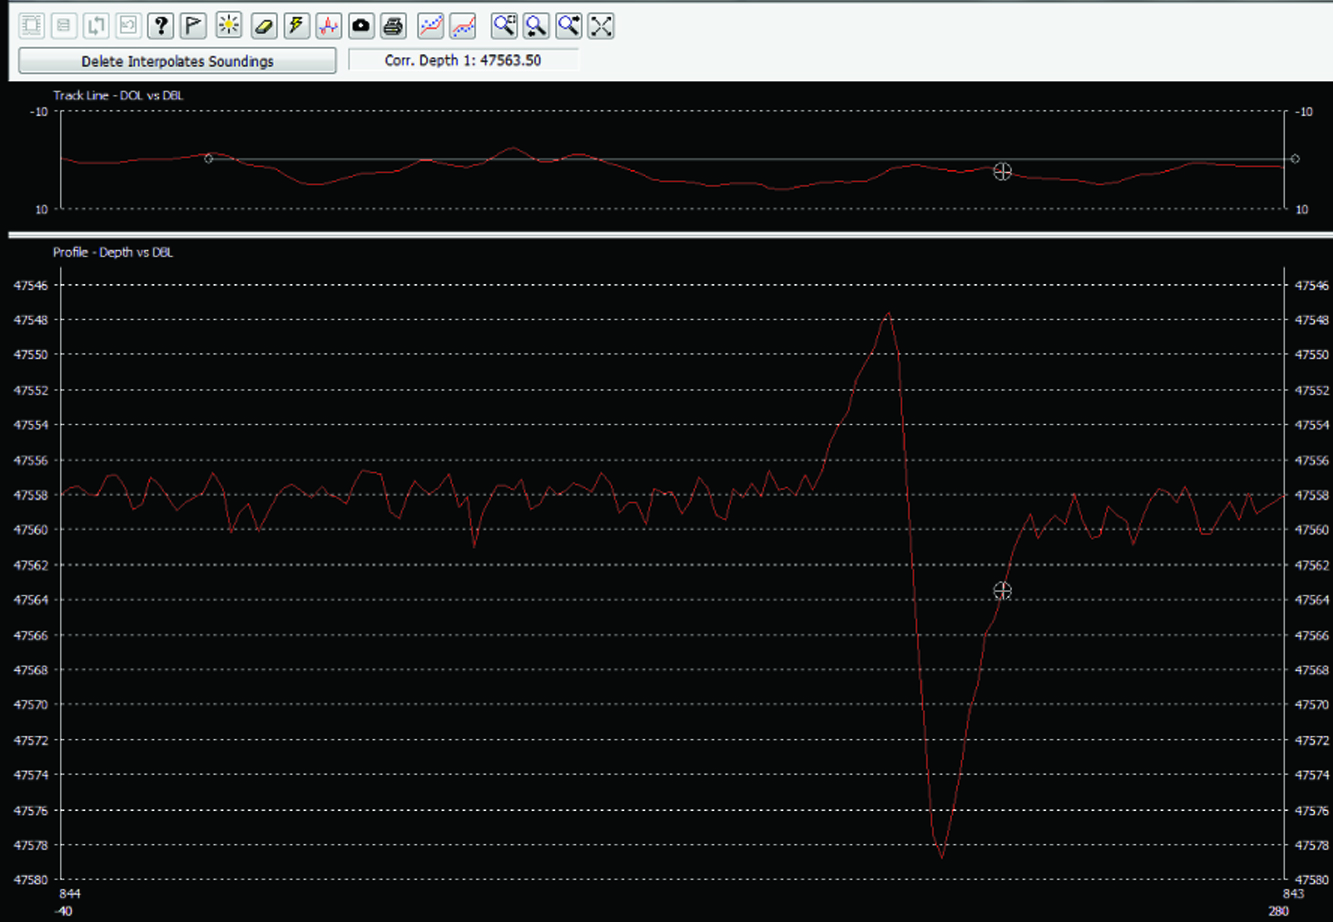
The “dipole” in this single line of magnetic data is part of one of the most promising magnetic targets discovered during the 450th Anniversary Shipwreck Survey.
When all data is captured, we head for the barn and post-process. This procedure is where we examine the data lane-by-lane, make corrections to filter out noise and eliminate any natural gradient in the background field.
During the analysis phase, we also look for humps and bumps in the magnetic field that may represent a disturbance caused by a shipwreck. Each lane may have the bumps, and when we plot them out on a map, using special software, sometimes the bumps line up. Think of magnetic contouring as connecting points on a sheet of paper that all have the same value. If you connect them with a line, the lines may create shapes like concentric circles, or globular patterns. Knowing a little something about magnetics gives the shapes meaning.
A single set of concentric circles, or ovals, may indicate the presence of a ‘monopole’ target. Monopoles usually indicate the presence of an isolated target, like a lost anchor, a cannon ball, or a simple piece of metal debris.
A pair of concentric circles, adjacent to each other indicates a ‘dipole’ target, or a target with two poles. The poles will usually contain one negatively charged pole, and one positively charged pole. When we see this, our ears perk up and further analysis begins.
Magnetic signatures have several features which can be measured and used for diagnosis. Shape, orientation, extent, and the “mass” of the magnetic field are all important. The “mass” is not really measured as such, for magnetic frequencies have no measurable mass. However, we measure magnetic field strength in scientific units called ‘nanoteslas’ or ‘gammas’, the terms are interchangeable. Nanoteslas are usually expressed with the abbreviation ‘nT’ and gammas with the simple letter ‘g’.
This measurement is the amount a magnetic anomaly deviates up or down from the ambient field. By applying positive/negative numbers to the field we can visualize the horizontal slice of the earth’s magnetic field and anything that causes a deviation.
Think of deviations like valleys and ridges, holes and mounds. Lying out magnetic data thusly creates a visual that is very helpful to the analyst.

These magnetic contours represent the five targets chosen for further investigation during the 450th Survey project. Note how each of them have both a positive (red) and negative (blue) pole, which is one of the criteria archaeologists look for when analyzing magnetic data for potential shipwreck sites.
When all of the data is gathered and processed, we end up with contour maps of the magnetic field within a survey area. Targets that have all of the right attributes are analyzed for the best drop locations for divers, the location for those points extracted, and the hunt is on for new shipwrecks!
Stay tuned to see what some of these magnetic targets revealed over the course of the 450th Anniversary Shipwreck Survey!
Brendan Burke joined the St. Augustine Lighthouse & Maritime Museum in 2007 as an archaeologist for the Lighthouse Archaeological Maritime Program. He holds a graduate degree in Anthropology from the College of William & Mary.